Predefined Epidemic Models

If you are running this tutorial on Google Colab, you can install the needed packages by running the following cell:
import sys, os, subprocess
if "google.colab" in sys.modules or os.getenv("COLAB_RELEASE_TAG"):
    subprocess.run([sys.executable, "-m", "pip", "install", "-q", "-r",
                    "https://raw.githubusercontent.com/epistorm/epydemix/refs/heads/main/tutorials/colab_requirements.txt"])
epydemix ships with a library of ready-to-use epidemic models that can be loaded with a single call to load_predefined_model. This tutorial covers:
Backbone models — the structural archetypes: SIR, SEIR, SIS, SEIAR
Modular extensions — orthogonal additions that can be composed on any backbone:
Waning immunity
Vaccination
Outcome tracking (deaths or hospitalization)
Combining modules — how to stack multiple extensions
Overriding parameters after construction — including age-varying and time-varying rates
import numpy as np
import matplotlib.pyplot as plt

from epydemix import load_predefined_model
from epydemix.visualization import plot_quantiles
1. Backbone Models
A backbone is the core compartmental structure of a model. Four backbones are available.
Backbone |
Compartments |
Key feature |
|---|---|---|
|
S → I → R |
Classic, permanent immunity |
|
S → E → I → R |
Latent (exposed) period before infectiousness |
|
S → I → S |
No immunity — repeated reinfection |
|
S → E → {I, A} → R |
Asymptomatic pathway with reduced infectivity |
All backbones share three core parameters:
transmission_rate— rate of transmission from an infectious contactrecovery_rate— rate at which symptomatic infected individuals recoverincubation_rate— rate of progression from Exposed to Infected (SEIR and SEIAR only)
SIR
sir = load_predefined_model("SIR", transmission_rate=0.3, recovery_rate=0.1)
print(sir)
EpiModel(name='EpiModel')
Compartments: 3
  Susceptible, Infected, Recovered
Transitions: 2
  Transitions between compartments:
    Susceptible -> Infected, params: ('transmission_rate', 'Infected') (kind: mediated)
    Infected -> Recovered, params: recovery_rate (kind: spontaneous)
Parameters: 2
  Model parameters:
    transmission_rate: 0.3
    recovery_rate: 0.1
Population: epydemix_population
  Population size: 100000 individuals
  Demographic groups: 1
    0
sir_results = sir.run_simulations(start_date="2024-01-01", end_date="2024-06-01")
df = sir_results.get_quantiles_compartments()
plot_quantiles(df, columns=["Susceptible_total", "Infected_total", "Recovered_total"],
               title="SIR");

SEIR
The SEIR model adds an Exposed compartment. Individuals who are exposed are not yet infectious — they transition to Infected at the incubation_rate.
seir = load_predefined_model("SEIR", transmission_rate=0.3, incubation_rate=0.2, recovery_rate=0.1)
print(seir)
EpiModel(name='EpiModel')
Compartments: 4
  Susceptible, Exposed, Infected, Recovered
Transitions: 3
  Transitions between compartments:
    Susceptible -> Exposed, params: ('transmission_rate', 'Infected') (kind: mediated)
    Exposed -> Infected, params: incubation_rate (kind: spontaneous)
    Infected -> Recovered, params: recovery_rate (kind: spontaneous)
Parameters: 3
  Model parameters:
    transmission_rate: 0.3
    incubation_rate: 0.2
    recovery_rate: 0.1
Population: epydemix_population
  Population size: 100000 individuals
  Demographic groups: 1
    0
seir_results = seir.run_simulations(start_date="2024-01-01", end_date="2024-06-01")
df = seir_results.get_quantiles_compartments()
plot_quantiles(df, columns=["Susceptible_total", "Exposed_total", "Infected_total", "Recovered_total"],
               title="SEIR");

SIS
In the SIS model recovery returns individuals to the Susceptible pool — there is no lasting immunity. This is appropriate for diseases like seasonal influenza strains or many bacterial infections.
sis = load_predefined_model("SIS", transmission_rate=0.3, recovery_rate=0.1)
print(sis)
EpiModel(name='EpiModel')
Compartments: 2
  Susceptible, Infected
Transitions: 2
  Transitions between compartments:
    Susceptible -> Infected, params: ('transmission_rate', 'Infected') (kind: mediated)
    Infected -> Susceptible, params: recovery_rate (kind: spontaneous)
Parameters: 2
  Model parameters:
    transmission_rate: 0.3
    recovery_rate: 0.1
Population: epydemix_population
  Population size: 100000 individuals
  Demographic groups: 1
    0
sis_results = sis.run_simulations(start_date="2024-01-01", end_date="2024-06-01")
df = sis_results.get_quantiles_compartments()
plot_quantiles(df, columns=["Susceptible_total", "Infected_total"],
               title="SIS — endemic equilibrium");

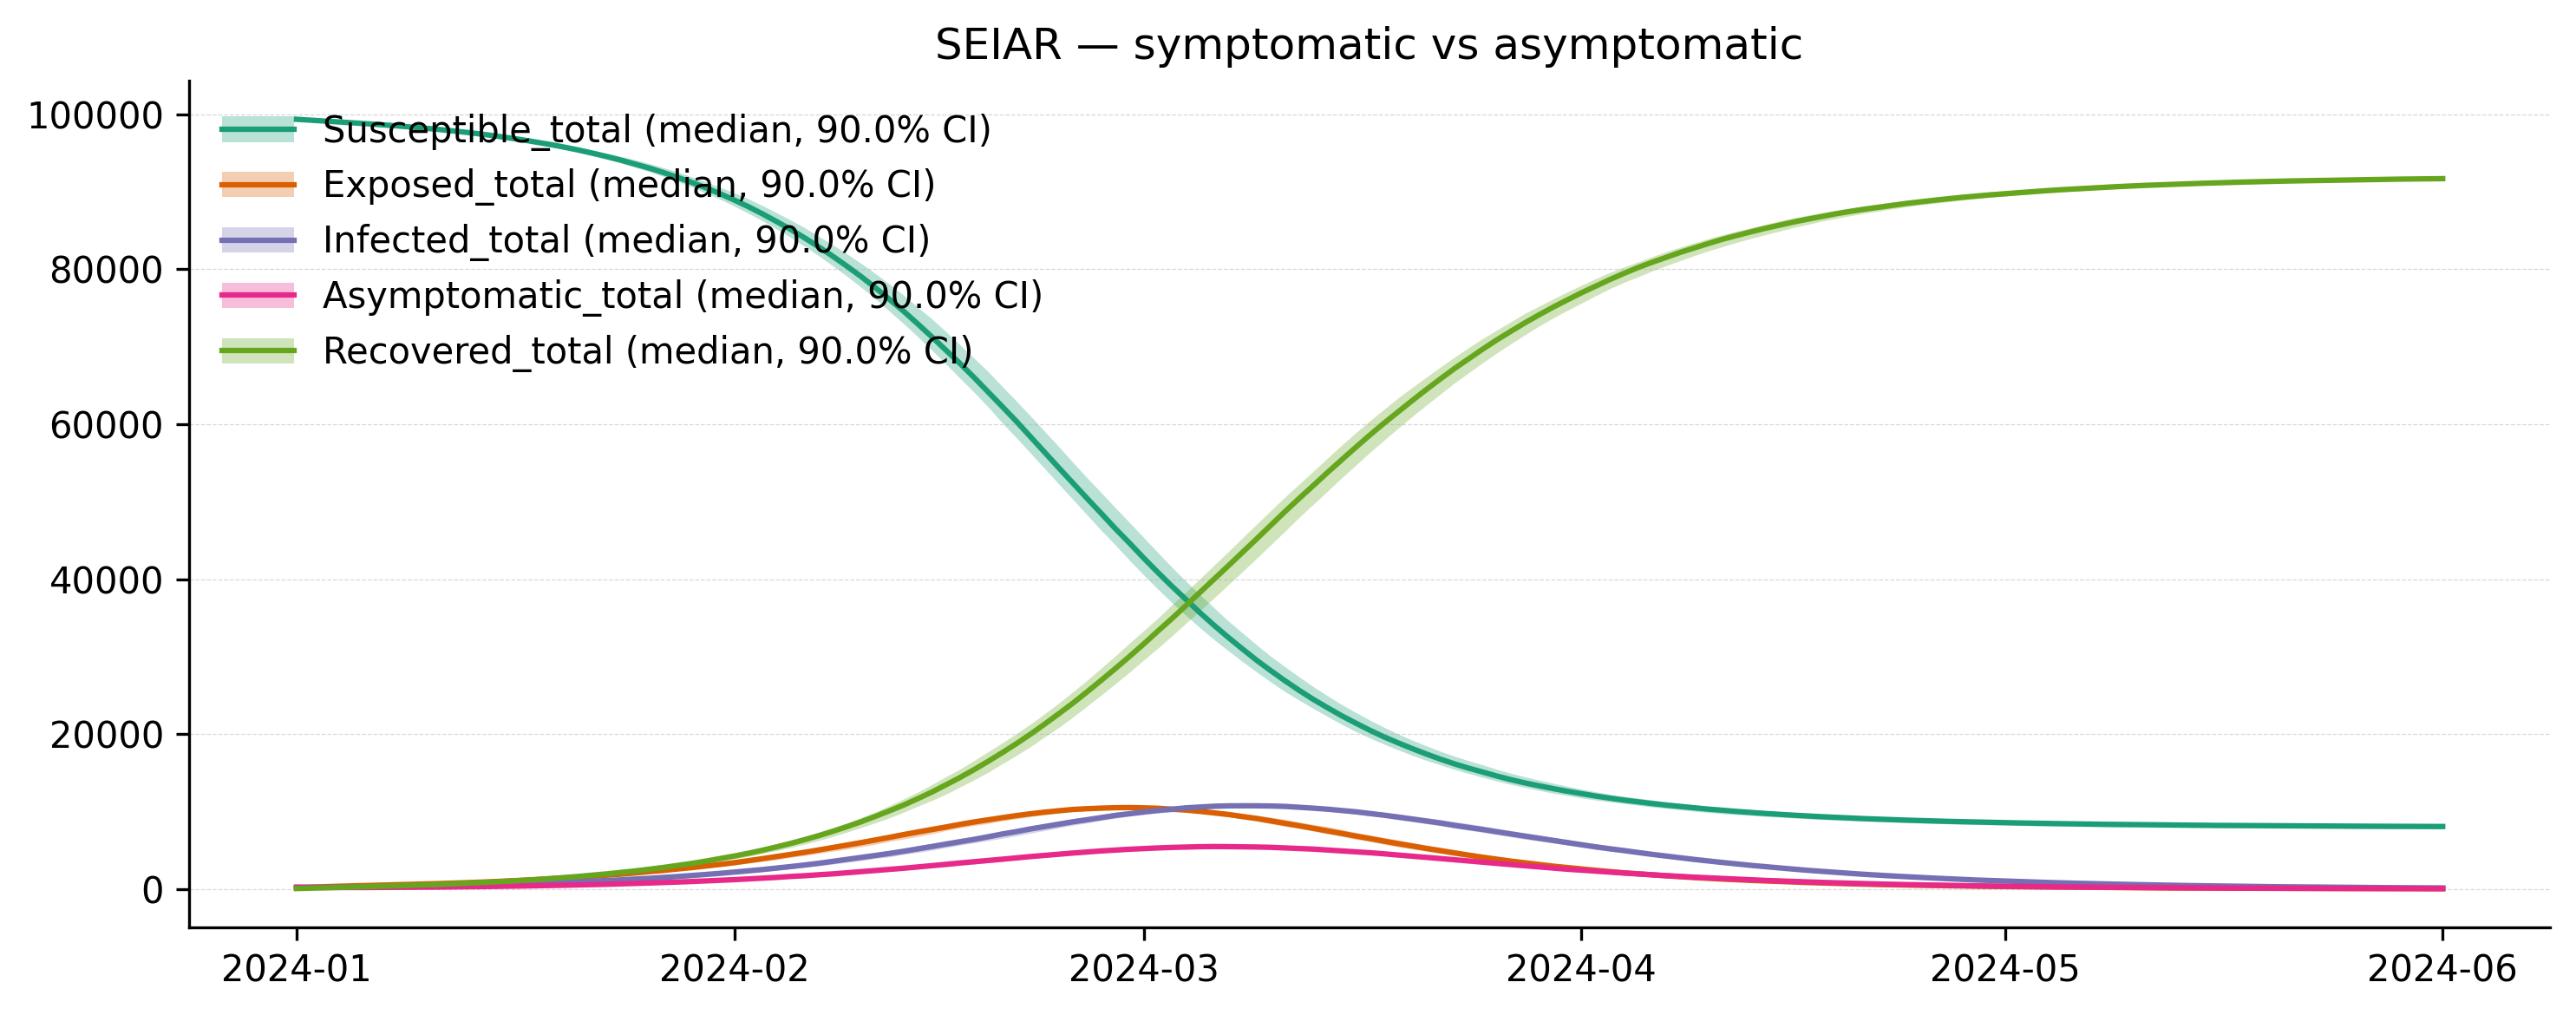
SEIAR — Asymptomatic Transmission
SEIAR extends SEIR with an Asymptomatic infectious pathway. After the exposed period, a fraction asymptomatic_fraction of individuals become asymptomatic (A) rather than symptomatic (I). Asymptomatics are infectious but at a reduced rate controlled by asymptomatic_relative_infectivity.
SEIAR-specific parameters:
Parameter |
Meaning |
Default |
|---|---|---|
|
Fraction of exposed who become asymptomatic |
0.4 |
|
Recovery rate for asymptomatic individuals |
0.14 |
|
Infectivity of A relative to I |
0.5 |
seiar = load_predefined_model(
    "SEIAR",
    transmission_rate=0.35,
    incubation_rate=0.2,
    recovery_rate=0.1,
    asymptomatic_fraction=0.4,
    asymptomatic_recovery_rate=0.14,
    asymptomatic_relative_infectivity=0.5,
)
print(seiar)
EpiModel(name='EpiModel')
Compartments: 5
  Susceptible, Exposed, Infected, Asymptomatic, Recovered
Transitions: 6
  Transitions between compartments:
    Susceptible -> Exposed, params: ('transmission_rate', 'Infected') (kind: mediated)
    Susceptible -> Exposed, params: ('transmission_rate * asymptomatic_relative_infectivity', 'Asymptomatic') (kind: mediated)
    Exposed -> Infected, params: incubation_rate * (1 - asymptomatic_fraction) (kind: spontaneous)
    Exposed -> Asymptomatic, params: incubation_rate * asymptomatic_fraction (kind: spontaneous)
    Infected -> Recovered, params: recovery_rate (kind: spontaneous)
    Asymptomatic -> Recovered, params: asymptomatic_recovery_rate (kind: spontaneous)
Parameters: 6
  Model parameters:
    transmission_rate: 0.35
    incubation_rate: 0.2
    recovery_rate: 0.1
    asymptomatic_fraction: 0.4
    asymptomatic_recovery_rate: 0.14
    asymptomatic_relative_infectivity: 0.5
Population: epydemix_population
  Population size: 100000 individuals
  Demographic groups: 1
    0
seiar_results = seiar.run_simulations(start_date="2024-01-01", end_date="2024-06-01", percentage_in_agents=0.005)
df = seiar_results.get_quantiles_compartments()
plot_quantiles(
    df,
    columns=["Susceptible_total", "Exposed_total", "Infected_total", "Asymptomatic_total", "Recovered_total"],
    title="SEIAR — symptomatic vs asymptomatic",
);
2. Modular Extensions
Modular extensions add compartments and transitions on top of any backbone. They are activated by keyword arguments on load_predefined_model — no need to build a new model from scratch.
The three available modules are:
Module |
Flag |
What it adds |
|---|---|---|
Waning immunity |
|
R → S spontaneous transition |
Vaccination |
|
Vaccinated compartment, S → V → I/E at reduced rate (E if backbone has an Exposed compartment) |
Outcome |
|
Dead or Hospitalized compartment branching from I, as a fraction of the I outflow |
Each module has its own rate parameters with sensible defaults that can be overridden.
2.1 Waning Immunity
Setting waning_immunity=True adds an R → S transition. Individuals who have recovered gradually lose immunity and return to the susceptible pool, producing SIRS or SEIRS dynamics.
The waning_rate controls the speed of immunity loss and is expressed as the inverse of the average immunity duration in days. The default 1/365 corresponds to approximately one year of immunity.
# SIRS: SIR backbone + waning immunity
sirs = load_predefined_model(
    "SIR",
    transmission_rate=0.3,
    recovery_rate=0.1,
    waning_immunity=True,
    waning_rate=1.0 / 180,   # ~6 months of immunity
)
print(sirs)
EpiModel(name='EpiModel')
Compartments: 3
  Susceptible, Infected, Recovered
Transitions: 3
  Transitions between compartments:
    Susceptible -> Infected, params: ('transmission_rate', 'Infected') (kind: mediated)
    Infected -> Recovered, params: recovery_rate (kind: spontaneous)
    Recovered -> Susceptible, params: waning_rate (kind: spontaneous)
Parameters: 3
  Model parameters:
    transmission_rate: 0.3
    recovery_rate: 0.1
    waning_rate: 0.005555555555555556
Population: epydemix_population
  Population size: 100000 individuals
  Demographic groups: 1
    0
# Run over a longer horizon to see reinfection waves
sir_results  = load_predefined_model("SIR",  transmission_rate=0.3, recovery_rate=0.1
                                     ).run_simulations(start_date="2024-01-01", end_date="2025-06-01")
sirs_results = sirs.run_simulations(start_date="2024-01-01", end_date="2025-06-01")

fig, axes = plt.subplots(1, 2, figsize=(12, 4))
plot_quantiles(sir_results.get_quantiles_compartments(),
               columns=["Susceptible_total", "Infected_total", "Recovered_total"],
               title="SIR (permanent immunity)", ax=axes[0])
plot_quantiles(sirs_results.get_quantiles_compartments(),
               columns=["Susceptible_total", "Infected_total", "Recovered_total"],
               title="SIRS (waning immunity, 6 months)", ax=axes[1])
plt.tight_layout();

The SIRS model reaches an endemic equilibrium rather than dying out, because the returning susceptibles sustain repeated transmission waves.
Note:
waning_immunity=Trueis not compatible withSIS(which has no Recovered compartment) and will raise aValueError.
2.2 Vaccination
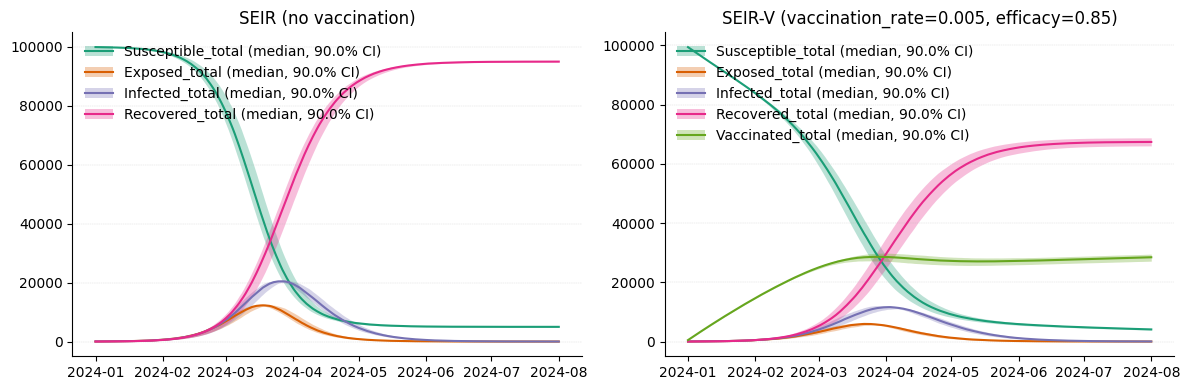
Setting vaccination=True adds a Vaccinated compartment with two transitions:
S → Vaccinated(spontaneous, ratevaccination_rate)Vaccinated → Infected(mediated by Infected, ratetransmission_rate * (1 - vaccine_efficacy)) — orVaccinated → Exposedif the backbone has an Exposed compartment (SEIR, SEIAR), so breakthrough infections re-enter the incubation stage
Vaccinated individuals can still get infected, but at a reduced rate proportional to (1 - vaccine_efficacy).
# SEIR-V: SEIR backbone + vaccination
seir_v = load_predefined_model(
    "SEIR",
    transmission_rate=0.3,
    incubation_rate=0.2,
    recovery_rate=0.1,
    vaccination=True,
    vaccination_rate=0.005,   # 0.5% of susceptibles vaccinated per day
    vaccine_efficacy=0.85,
)
print(seir_v)
EpiModel(name='EpiModel')
Compartments: 5
  Susceptible, Exposed, Infected, Recovered, Vaccinated
Transitions: 5
  Transitions between compartments:
    Susceptible -> Exposed, params: ('transmission_rate', 'Infected') (kind: mediated)
    Exposed -> Infected, params: incubation_rate (kind: spontaneous)
    Infected -> Recovered, params: recovery_rate (kind: spontaneous)
    Susceptible -> Vaccinated, params: vaccination_rate (kind: spontaneous)
    Vaccinated -> Exposed, params: ('transmission_rate * (1 - vaccine_efficacy)', 'Infected') (kind: mediated)
Parameters: 5
  Model parameters:
    transmission_rate: 0.3
    incubation_rate: 0.2
    recovery_rate: 0.1
    vaccination_rate: 0.005
    vaccine_efficacy: 0.85
Population: epydemix_population
  Population size: 100000 individuals
  Demographic groups: 1
    0
seir_results  = load_predefined_model("SEIR", transmission_rate=0.3, incubation_rate=0.2, recovery_rate=0.1
                                      ).run_simulations(start_date="2024-01-01", end_date="2024-08-01")
seir_v_results = seir_v.run_simulations(start_date="2024-01-01", end_date="2024-08-01")

fig, axes = plt.subplots(1, 2, figsize=(12, 4))
plot_quantiles(seir_results.get_quantiles_compartments(),
               columns=["Susceptible_total", "Exposed_total", "Infected_total", "Recovered_total"],
               title="SEIR (no vaccination)", ax=axes[0])
plot_quantiles(seir_v_results.get_quantiles_compartments(),
               columns=["Susceptible_total", "Exposed_total", "Infected_total",
                        "Recovered_total", "Vaccinated_total"],
               title="SEIR-V (vaccination_rate=0.005, efficacy=0.85)", ax=axes[1])
plt.tight_layout();
2.3 Outcome Tracking
The outcome argument adds a terminal or absorbing branch from the Infected compartment. Two outcomes are supported:
outcome="deaths"— adds a Dead compartment.mortality_rateis the fraction of the Infected outflow that goes to Dead;Infected → Recoveredis rescaled by(1 - mortality_rate)accordingly.outcome="hospitalization"— adds a Hospitalized compartment with two transitions:I → HospitalizedandHospitalized → Recovered.hospitalization_rateis likewise the fraction of the Infected outflow that goes to Hospitalized (rescalingInfected → Recoveredby(1 - hospitalization_rate));hospitalization_recovery_rateis a standalone rate forHospitalized → Recovered.
Only one outcome can be active at a time.
# SIRD
sird = load_predefined_model(
    "SIR",
    transmission_rate=0.3,
    recovery_rate=0.1,
    outcome="deaths",
    mortality_rate=0.005,
)
print(sird)
EpiModel(name='EpiModel')
Compartments: 4
  Susceptible, Infected, Recovered, Dead
Transitions: 3
  Transitions between compartments:
    Susceptible -> Infected, params: ('transmission_rate', 'Infected') (kind: mediated)
    Infected -> Recovered, params: recovery_rate * (1 - mortality_rate) (kind: spontaneous)
    Infected -> Dead, params: recovery_rate * mortality_rate (kind: spontaneous)
Parameters: 3
  Model parameters:
    transmission_rate: 0.3
    recovery_rate: 0.1
    mortality_rate: 0.005
Population: epydemix_population
  Population size: 100000 individuals
  Demographic groups: 1
    0
sird_results = sird.run_simulations(
    start_date="2024-01-01",
    end_date="2024-06-01",
    initial_conditions_dict={
        "Susceptible": np.array([99900]),
        "Infected": np.array([100]),
        "Recovered": np.array([0]),
        "Dead": np.array([0]),
    },
)
df = sird_results.get_quantiles_compartments()
plot_quantiles(df,
               columns=["Susceptible_total", "Infected_total", "Recovered_total", "Dead_total"],
               title="SIRD");

# SEIRH — SEIR with hospitalization
seirh = load_predefined_model(
    "SEIR",
    transmission_rate=0.3,
    incubation_rate=0.2,
    recovery_rate=0.1,
    outcome="hospitalization",
    hospitalization_rate=0.02,
    hospitalization_recovery_rate=0.05,
)
print(seirh)
EpiModel(name='EpiModel')
Compartments: 5
  Susceptible, Exposed, Infected, Recovered, Hospitalized
Transitions: 5
  Transitions between compartments:
    Susceptible -> Exposed, params: ('transmission_rate', 'Infected') (kind: mediated)
    Exposed -> Infected, params: incubation_rate (kind: spontaneous)
    Infected -> Recovered, params: recovery_rate * (1 - hospitalization_rate) (kind: spontaneous)
    Infected -> Hospitalized, params: recovery_rate * hospitalization_rate (kind: spontaneous)
    Hospitalized -> Recovered, params: hospitalization_recovery_rate (kind: spontaneous)
Parameters: 5
  Model parameters:
    transmission_rate: 0.3
    incubation_rate: 0.2
    recovery_rate: 0.1
    hospitalization_rate: 0.02
    hospitalization_recovery_rate: 0.05
Population: epydemix_population
  Population size: 100000 individuals
  Demographic groups: 1
    0
seirh_results = seirh.run_simulations(
    start_date="2024-01-01",
    end_date="2024-06-01",
    initial_conditions_dict={
        "Susceptible": np.array([99900]),
        "Exposed": np.array([0]),
        "Infected": np.array([100]),
        "Recovered": np.array([0]),
        "Hospitalized": np.array([0]),
    },
)
df = seirh_results.get_quantiles_compartments()
plot_quantiles(
    df,
    columns=["Susceptible_total", "Exposed_total", "Infected_total",
             "Recovered_total", "Hospitalized_total"],
    title="SEIRH — hospitalization burden",
);

3. Combining Modules
All three modules can be stacked freely on any backbone. The extensions are applied in order: waning → vaccination → outcome. The only constraints are:
waning_immunityandoutcome="hospitalization"both require a Recovered compartment — they are incompatible withSIS.Only one
outcomevalue can be set at a time.
Below is an example combining waning immunity and deaths on SEIAR — a model that may represent a disease with asymptomatic transmission, short-lived immunity, and a mortality risk.
seiar_wd = load_predefined_model(
    "SEIAR",
    transmission_rate=0.35,
    incubation_rate=0.2,
    recovery_rate=0.1,
    asymptomatic_fraction=0.4,
    asymptomatic_recovery_rate=0.14,
    asymptomatic_relative_infectivity=0.5,
    # waning immunity
    waning_immunity=True,
    waning_rate=1.0 / 180,
    # deaths
    outcome="deaths",
    mortality_rate=0.003,
)
print(seiar_wd)
EpiModel(name='EpiModel')
Compartments: 6
  Susceptible, Exposed, Infected, Asymptomatic, Recovered, Dead
Transitions: 8
  Transitions between compartments:
    Susceptible -> Exposed, params: ('transmission_rate', 'Infected') (kind: mediated)
    Susceptible -> Exposed, params: ('transmission_rate * asymptomatic_relative_infectivity', 'Asymptomatic') (kind: mediated)
    Exposed -> Infected, params: incubation_rate * (1 - asymptomatic_fraction) (kind: spontaneous)
    Exposed -> Asymptomatic, params: incubation_rate * asymptomatic_fraction (kind: spontaneous)
    Infected -> Recovered, params: recovery_rate * (1 - mortality_rate) (kind: spontaneous)
    Asymptomatic -> Recovered, params: asymptomatic_recovery_rate (kind: spontaneous)
    Recovered -> Susceptible, params: waning_rate (kind: spontaneous)
    Infected -> Dead, params: recovery_rate * mortality_rate (kind: spontaneous)
Parameters: 8
  Model parameters:
    transmission_rate: 0.35
    incubation_rate: 0.2
    recovery_rate: 0.1
    asymptomatic_fraction: 0.4
    asymptomatic_recovery_rate: 0.14
    asymptomatic_relative_infectivity: 0.5
    waning_rate: 0.005555555555555556
    mortality_rate: 0.003
Population: epydemix_population
  Population size: 100000 individuals
  Demographic groups: 1
    0
seiar_wd_results = seiar_wd.run_simulations(
    start_date="2024-01-01",
    end_date="2025-06-01",
    initial_conditions_dict={
        "Susceptible": np.array([99900]),
        "Exposed": np.array([0]),
        "Infected": np.array([100]),
        "Asymptomatic": np.array([0]),
        "Recovered": np.array([0]),
        "Dead": np.array([0]),
    },
)
df = seiar_wd_results.get_quantiles_compartments()
plot_quantiles(
    df,
    columns=["Susceptible_total", "Infected_total", "Asymptomatic_total",
             "Recovered_total", "Dead_total"],
    title="SEIAR + waning immunity (6 months) + deaths",
);

4. Overriding Parameters After Construction
All rate parameters accept scalars, 1D arrays of shape (T,) for time-varying values, or 2D arrays of shape (T, G) for age-stratified values. The scalar defaults in load_predefined_model are convenience values — they can be replaced after construction via add_parameter.
This is particularly useful for the modular parameters. For example, a vaccination_rate that ramps up over time, or a waning_rate that differs across age groups, are both straightforward to express.
from epydemix.utils import compute_simulation_dates

start_date, end_date = "2024-01-01", "2024-08-01"
dates = compute_simulation_dates(start_date=start_date, end_date=end_date)
T = len(dates)

# Vaccination campaign: starts at 0, ramps up linearly over 60 days, then plateaus
vaccination_rate = np.clip(np.linspace(0, 0.01, T), 0, 0.01)
vaccination_rate[60:] = 0.01

model = load_predefined_model(
    "SEIR",
    transmission_rate=0.3,
    incubation_rate=0.2,
    recovery_rate=0.1,
    vaccination=True,
    vaccine_efficacy=0.85,
)

# Replace the scalar default with the time-varying array
model.add_parameter(parameter_name="vaccination_rate", value=vaccination_rate)

results = model.run_simulations(start_date=start_date, end_date=end_date)
df = results.get_quantiles_compartments()
plot_quantiles(
    df,
    columns=["Susceptible_total", "Infected_total", "Recovered_total", "Vaccinated_total"],
    title="SEIR-V with time-varying vaccination rate (ramp-up over 60 days)",
);

Summary
The table below lists every common named model and its corresponding load_predefined_model call:
Common name |
Call |
|---|---|
SIR |
|
SEIR |
|
SIS |
|
SEIAR |
|
SIRS |
|
SEIRS |
|
SEIR-V |
|
SIRD |
|
SEIRD |
|
SEIRH |
|
SEIRS-V |
|
SEIAR + waning + deaths |
|
For any model not in this list, you can always define a custom model from scratch using EpiModel directly — see Tutorial 1 and Tutorial 6.